Learn how to create an amazing looking Microsoft Excel dashboard in this project based course! Read more.
We are here to teach you professional courses that are project based and focus on real life scenarios. All of our courses have assignments that let you practice the new skills that you have learned during your course. We have a wealth of experience in the corporate world and are excited to share our knowledge and skills with you. Learnhoot Professional will be providing courses in the following areas: - Microsoft Office - Accounting - Financial Analysis - Productivity - Gene
Access all courses in our library for only $9/month with All Access Pass
Get Started with All Access PassBuy Only This CourseAbout This Course
Who this course is for:
- You would like to improve your Microsoft Excel skills
- You use Microsoft Excel in the workplace or in your professional life
- You want to learn how to interpret large data sets and perform visual analysis
What you’ll learn:
- Designing a Sales Dashboard
- Learning the Basics of Pivot Charts
- Learning how to Create Fantastic Gradients
- Designing Beautiful Slicers
- The Power of Pivot Charts
- How to Transform a Large Data Set into Visually Appealing Charts
- How to Automatically Refresh a Dashboard with Basic VBA
Requirements:
- Have access to Microsoft Excel (ideally Office 365). Some features that I use may not be available on other versions. However, you should still be able to complete the course with the alternatives that are suggested.
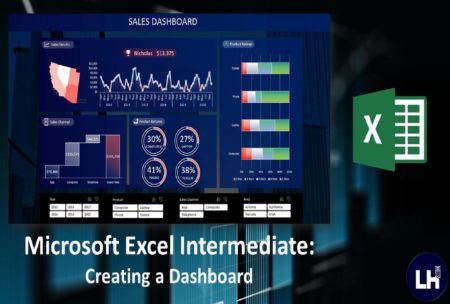
Learn how to create an amazing looking Microsoft Excel dashboard in this project based course!
If you use Microsoft Excel in your professional life, or even personal life, then this class will be perfect for you.
This class is a project based class in which we will work together from beginning to end to create a dashboard in Microsoft Excel. It is designed as if we were in the workplace and have been assigned a new task.
You do not need any knowledge of Microsoft Excel to follow along with this course as we will start together from the beginning and work our way up to creating an amazing looking dashboard.
To start with, I will explain to you the fundamentals of a Pivot Table and how we can use them effectively for Dashboards. I will then show you how to create all of the charts that are needed for the dashboard. I will also show you how slicers work and how to make them look much better! You will also learn how to make the dashboard automatically refresh when new data is added to the data set. Finally, we will put it altogether and design an amazing looking dashboard.
After taking this class, you should feel confident in your ability to create a dashboard and transform a large data set into an insightful visual dashboard.
Our Promise to You
By the end of this course, you will have learned how to transform a large data set into a visual dashboard.
10 Day Money Back Guarantee. If you are unsatisfied for any reason, simply contact us and we’ll give you a full refund. No questions asked.
Get started today!
Course Curriculum
| Section 1 - Exercise Files | |||
| Exercise Files | 00:00:00 | ||
| Section 2 - Microsoft Excel Intermediate - Creating A Dashboard | |||
| Working With Data Sets In Microsoft Excel | 00:00:00 | ||
| Introduction To Pivot Tables In Microsoft Excel | 00:00:00 | ||
| Creating Charts For An Excel Dashboard | 00:00:00 | ||
| Designing A Dashboard In Microsoft Excel | 00:00:00 | ||
| Adding Charts To An Excel Dashboard | 00:00:00 | ||
| Creating Custom Slicers In Microsoft Excel | 00:00:00 | ||
| Automatically Refreshing Pivot Tables With VBA | 00:00:00 | ||
| Section 3 - Congratulations! And Your Assignment | |||
| Create Your Own Dashboard! | 00:00:00 | ||
About This Course
Who this course is for:
- You would like to improve your Microsoft Excel skills
- You use Microsoft Excel in the workplace or in your professional life
- You want to learn how to interpret large data sets and perform visual analysis
What you’ll learn:
- Designing a Sales Dashboard
- Learning the Basics of Pivot Charts
- Learning how to Create Fantastic Gradients
- Designing Beautiful Slicers
- The Power of Pivot Charts
- How to Transform a Large Data Set into Visually Appealing Charts
- How to Automatically Refresh a Dashboard with Basic VBA
Requirements:
- Have access to Microsoft Excel (ideally Office 365). Some features that I use may not be available on other versions. However, you should still be able to complete the course with the alternatives that are suggested.
Learn how to create an amazing looking Microsoft Excel dashboard in this project based course!
If you use Microsoft Excel in your professional life, or even personal life, then this class will be perfect for you.
This class is a project based class in which we will work together from beginning to end to create a dashboard in Microsoft Excel. It is designed as if we were in the workplace and have been assigned a new task.
You do not need any knowledge of Microsoft Excel to follow along with this course as we will start together from the beginning and work our way up to creating an amazing looking dashboard.
To start with, I will explain to you the fundamentals of a Pivot Table and how we can use them effectively for Dashboards. I will then show you how to create all of the charts that are needed for the dashboard. I will also show you how slicers work and how to make them look much better! You will also learn how to make the dashboard automatically refresh when new data is added to the data set. Finally, we will put it altogether and design an amazing looking dashboard.
After taking this class, you should feel confident in your ability to create a dashboard and transform a large data set into an insightful visual dashboard.
Our Promise to You
By the end of this course, you will have learned how to transform a large data set into a visual dashboard.
10 Day Money Back Guarantee. If you are unsatisfied for any reason, simply contact us and we’ll give you a full refund. No questions asked.
Get started today!
Course Curriculum
| Section 1 - Exercise Files | |||
| Exercise Files | 00:00:00 | ||
| Section 2 - Microsoft Excel Intermediate - Creating A Dashboard | |||
| Working With Data Sets In Microsoft Excel | 00:00:00 | ||
| Introduction To Pivot Tables In Microsoft Excel | 00:00:00 | ||
| Creating Charts For An Excel Dashboard | 00:00:00 | ||
| Designing A Dashboard In Microsoft Excel | 00:00:00 | ||
| Adding Charts To An Excel Dashboard | 00:00:00 | ||
| Creating Custom Slicers In Microsoft Excel | 00:00:00 | ||
| Automatically Refreshing Pivot Tables With VBA | 00:00:00 | ||
| Section 3 - Congratulations! And Your Assignment | |||
| Create Your Own Dashboard! | 00:00:00 | ||


Very Interesting
It is a good intermediate Excel course and I learned many new tips and tricks. This information will be very helpful in my work.